
Can Passive Roof Vents Really Move That Much Air?
Estimating GAF Attic Ventilation with Physics
When we bought the house, the roof was already about 30 years old. Replacing it also changed the attic ventilation system to a continuous GAF passive setup. No fan, no motor—so how much air can it really move? I used the actual vent dimensions and measured attic temperature to estimate CFM, ACH, and heat removal.
Quick results
| Attic temperature | 45.2°C, outdoor air about 35°C → representative ΔT = 10°C |
|---|---|
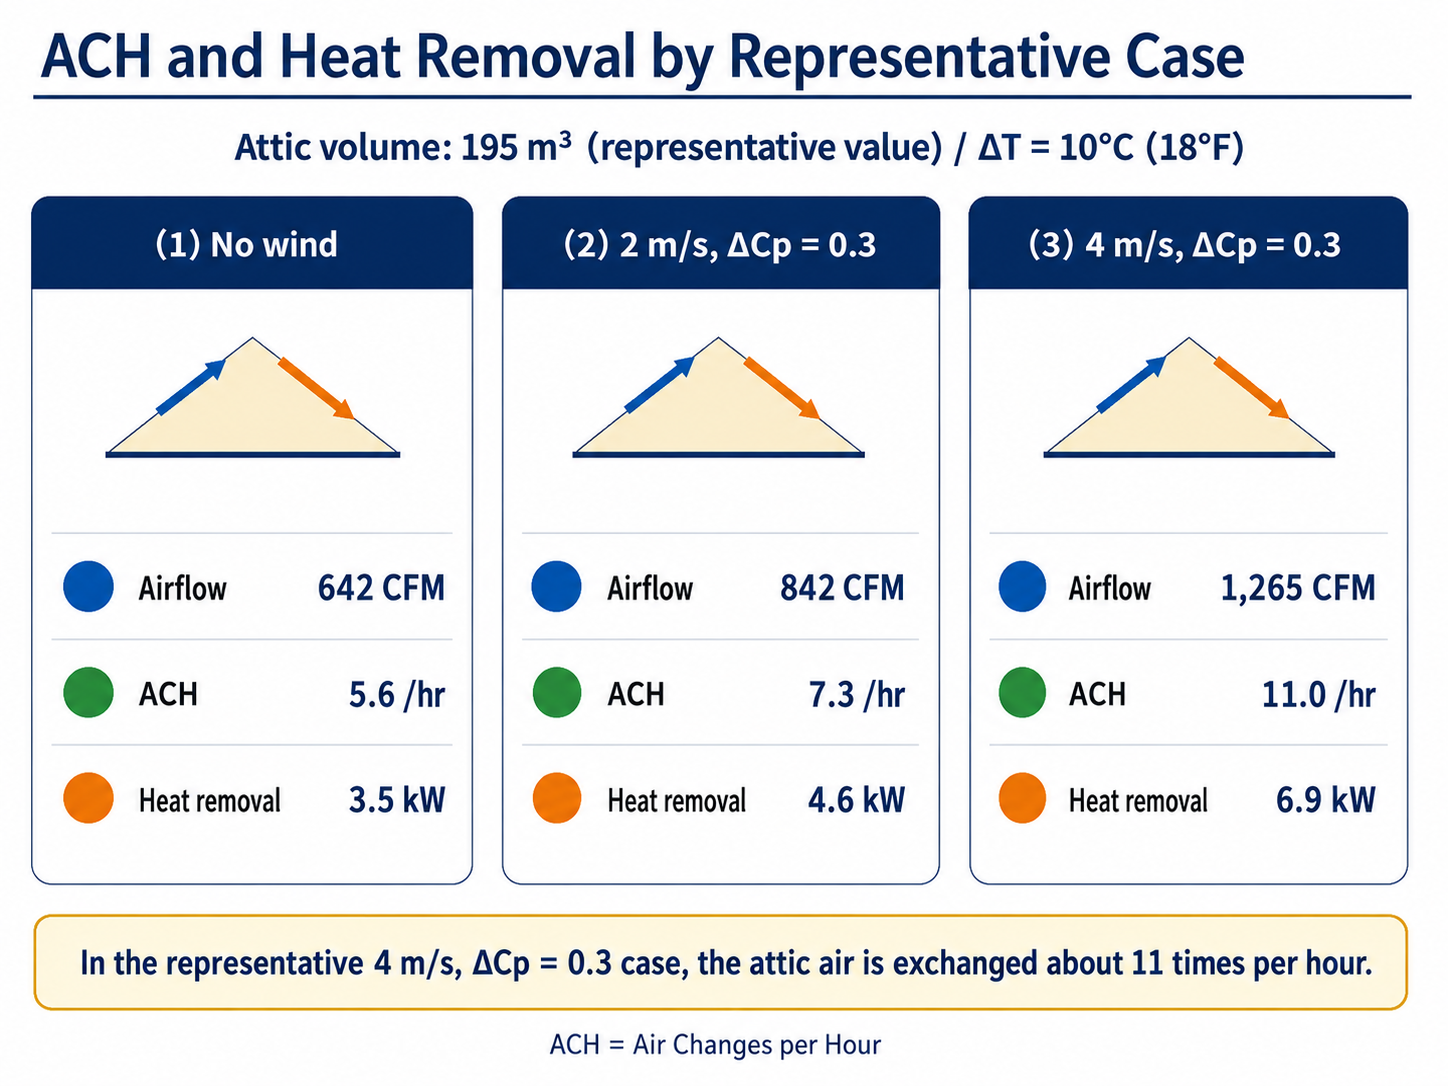
| No wind | About 642 CFM / 5.6 ACH / 3.5 kW sensible heat removal |
| 2 m/s, ΔCp = 0.3 | About 842 CFM / 7.3 ACH / 4.6 kW |
| 4 m/s, ΔCp = 0.3 | About 1,265 CFM / 11.0 ACH / 6.9 kW |
| Important | These CFM values are estimates from a simplified physics model, not direct airflow measurements. |
Replacing the roof also changed the ventilation system
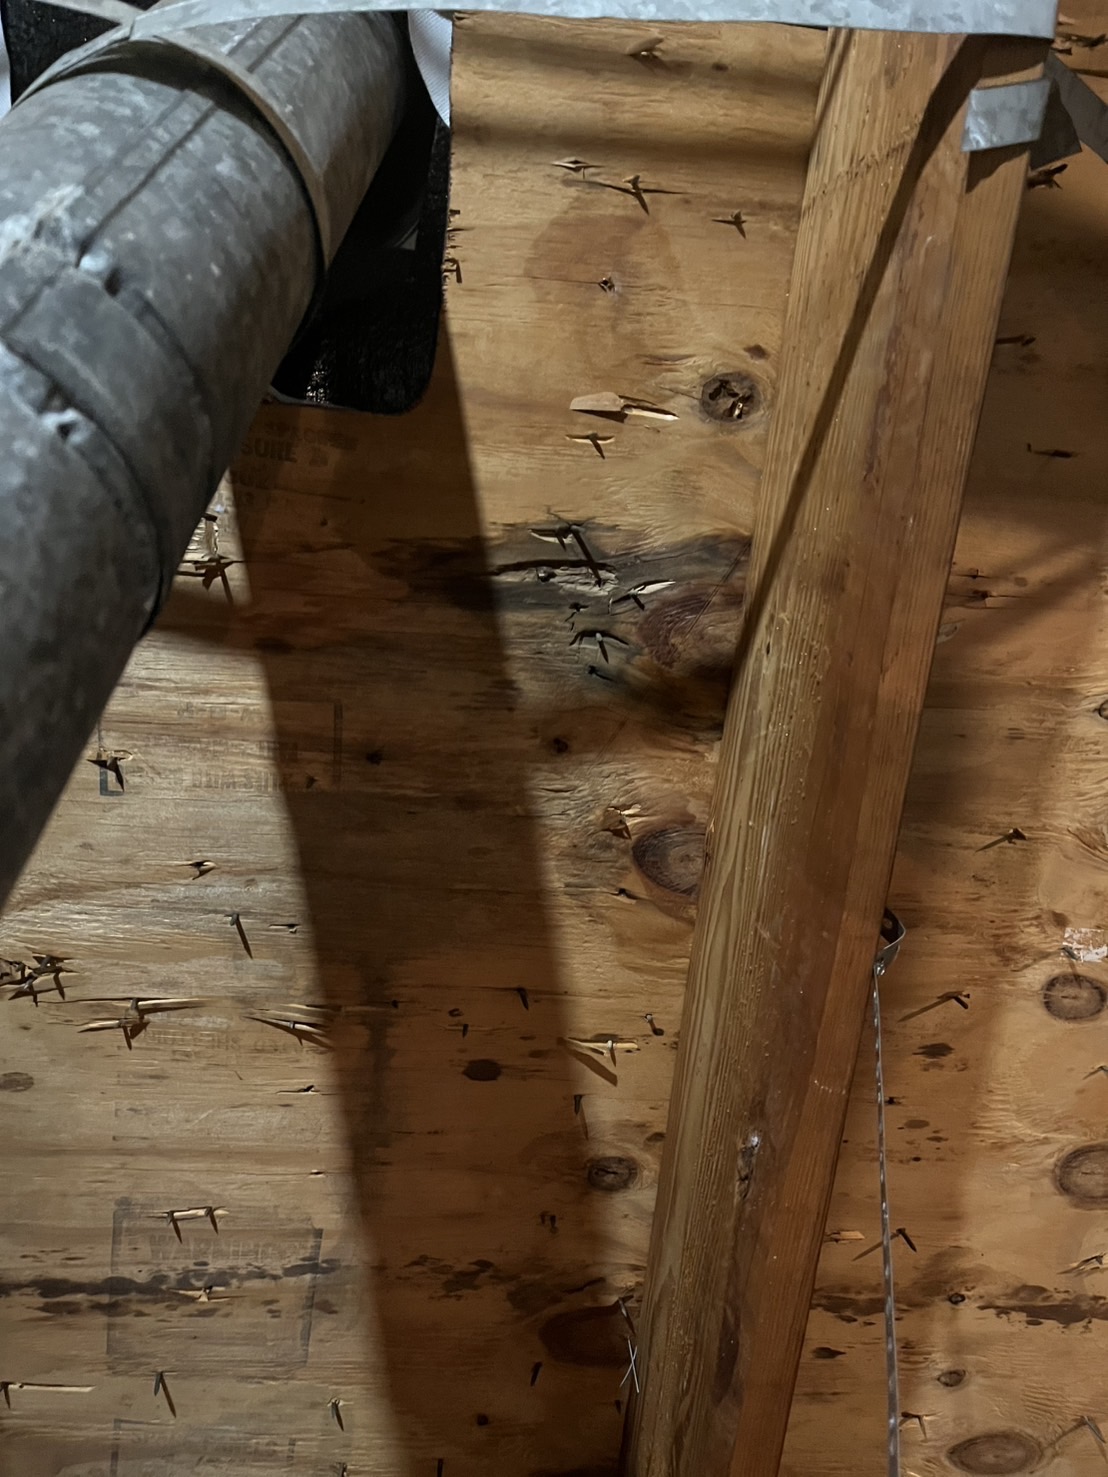
During the home inspection, we found what looked like old water-stain marks on the attic roof decking. The roof itself was also around 30 years old, so we decided it was time to replace it after moving in.
We chose a GAF roofing system, partly for the warranty. The old roof appears to have used turbine vents—the little wind-driven “whirlybird” style. The new roof uses a continuous passive system: intake air enters low on the roof and exits through ridge vents.
That immediately made me wonder: without a powered fan, how much ventilation can this actually provide? So I tried a simple calculation using measurements from the house.
A wind-driven turbine vent is technically passive ventilation too. Here I’m simply distinguishing the old turbine-vent setup from the new continuous intake + ridge-vent layout.
The ventilation setup
Based on the installed shape and photos, the intake appears to be a GAF Cobra IntakePro® Rooftop Intake Vent, while the exhaust appears to be Cobra Rigid Vent 3™. IntakePro is rated at 9 in² of Net Free Ventilating Area (NFA) per linear foot, and Rigid Vent 3 at 18 in²/linear ft.[1][2]
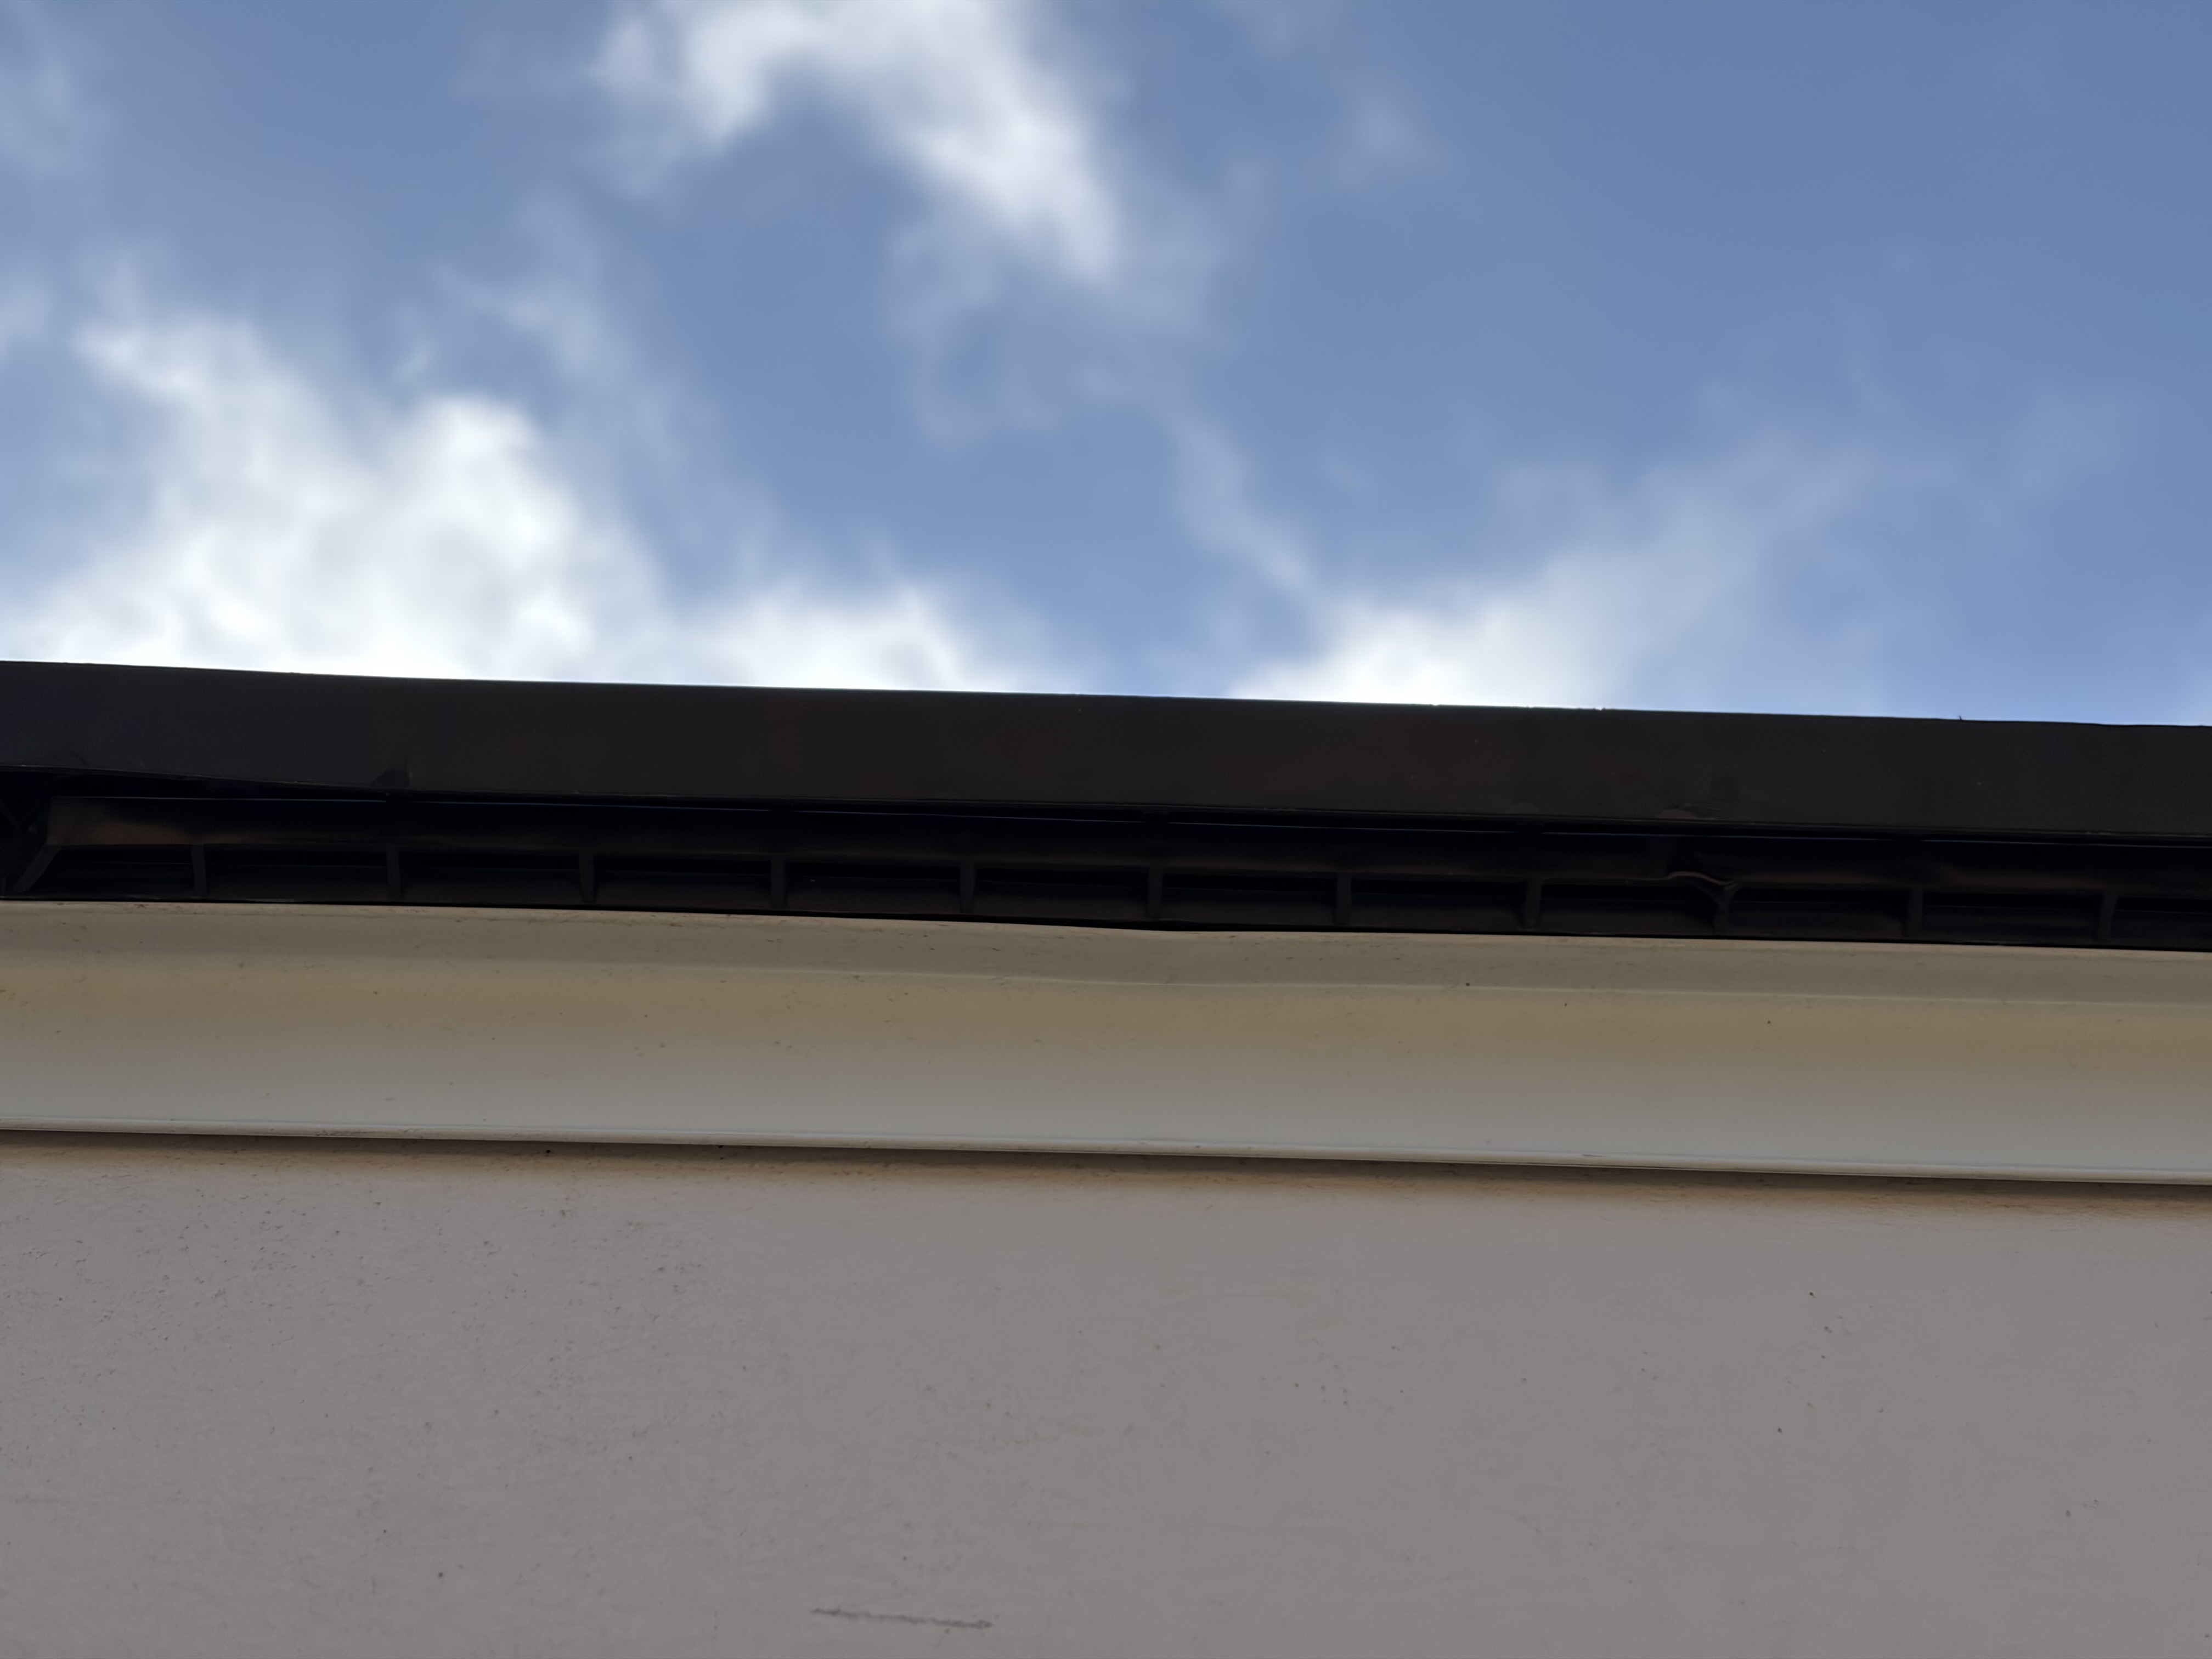
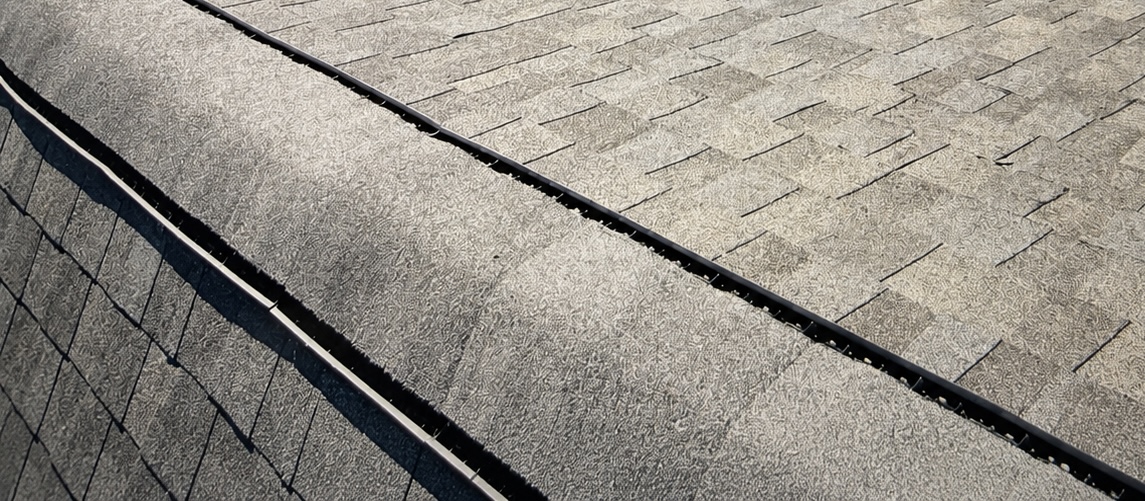
The product IDs are based on the installed shape and photos; I have not verified the exact model numbers from the contractor paperwork.
First, how much free vent area is there?
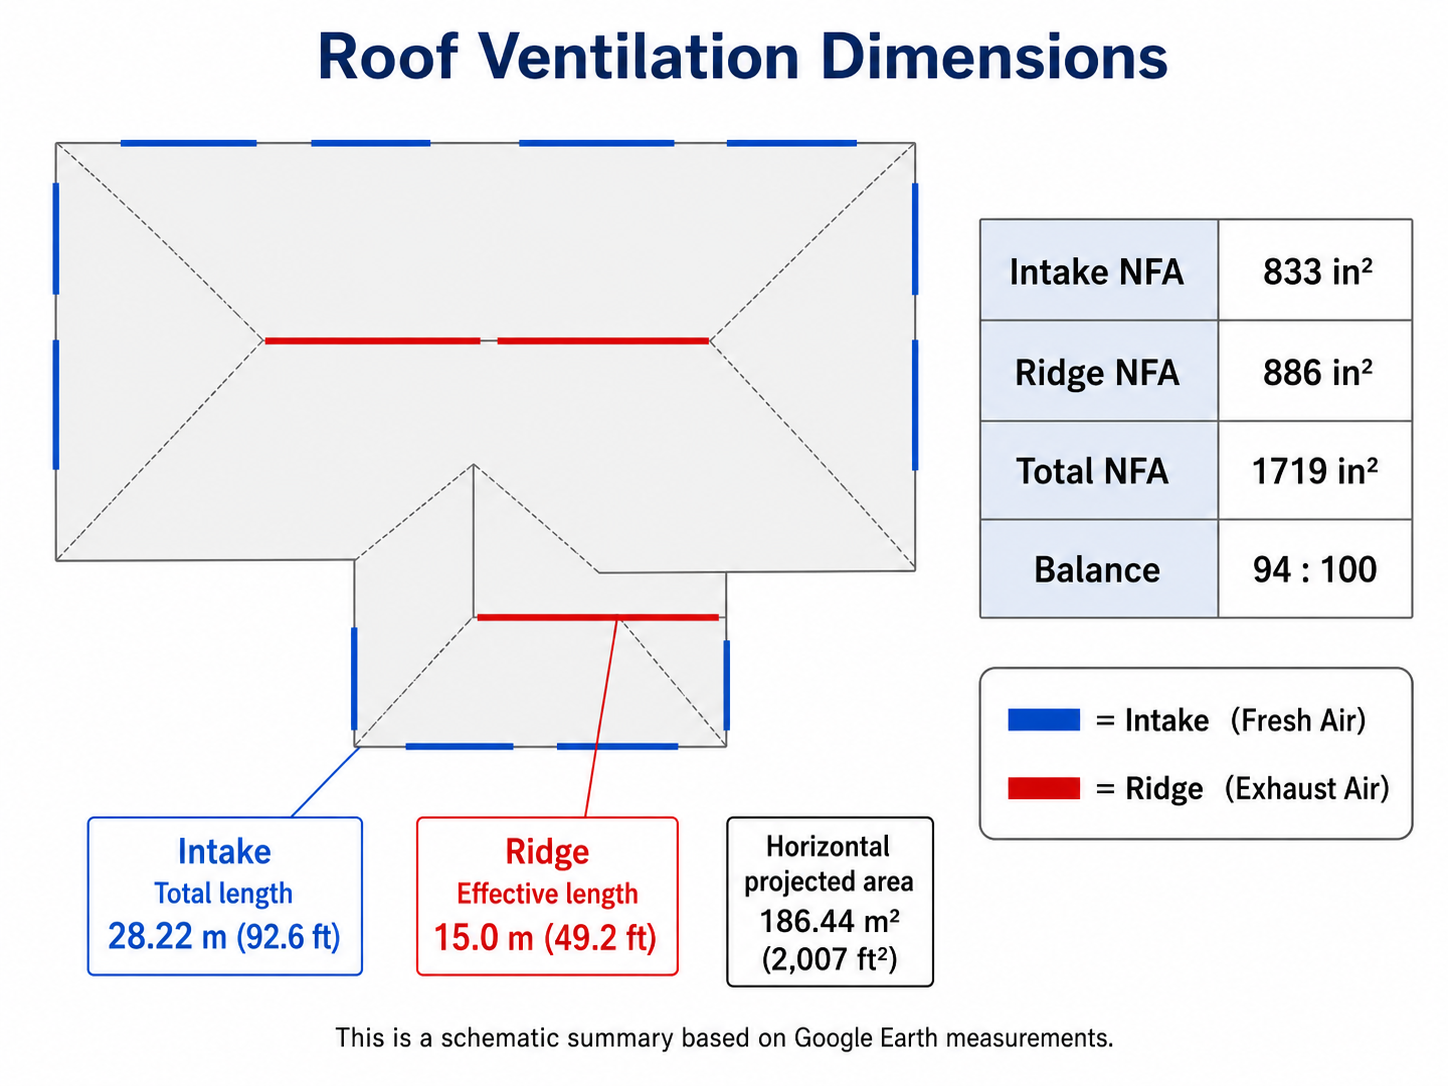
I measured the installed lengths using Google Earth and site photos.
The intake length is 28.22 m, or about 92.6 ft. At 9 in²/linear ft:
The ridge system consists of one main ridge plus three smaller ridges, for four ridge-vent runs total. Google Earth gives a combined length of 16.6 m, but the vent does not extend all the way to the ends. Allowing roughly 20 cm at each end of each run gives an effective length of about 15.0 m, or 49.2 ft.
| Intake | Ridge exhaust | |
|---|---|---|
| Estimated installed length | 28.22 m | About 15.0 m total across 4 runs |
| NFA | 833 in² | 886 in² |
| Balance | 94 | 100 |
How does that compare with the required vent area?
The horizontal projected roof area is about 186.44 m², or about 2,007 ft². Applying GAF’s 1/300 rule as a simple comparison gives roughly 963 in² of total required NFA.[2]
The estimated total installed NFA is 833 + 886 = 1,719 in². So at least from an opening-area standpoint, the vents do not look undersized.
The 2,007 ft² value is the horizontal projected roof area, not a precise attic-floor area, and it includes overhangs. This is only an approximate comparison.
How much air can temperature difference move by itself?
The first driving force is stack effect. Warmer attic air is less dense, so it tends to rise toward the ridge and pull outdoor air in through the low intake.
I do not have the exact roof pitch from the plans, so I estimated roughly 4:12 to 6:12 from photos and used 5:12 as the representative value. With about 6.36 m of horizontal run from eave to ridge, the height difference is about 2.65 m.
Measuring the attic temperature
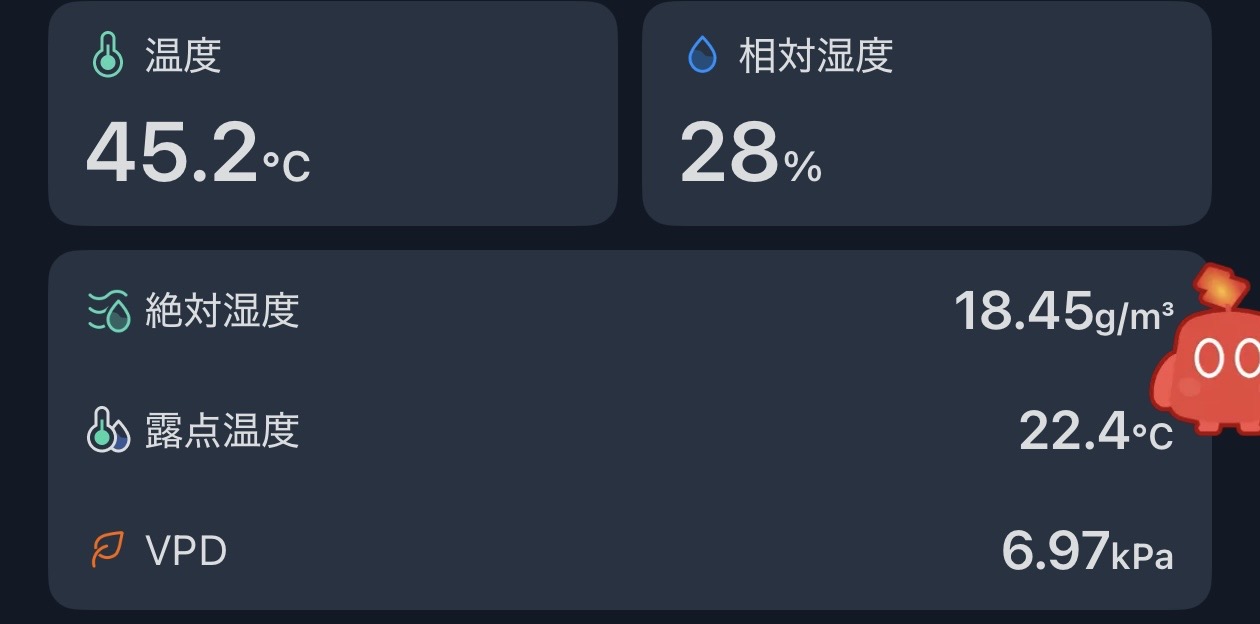
I suspended the thermometer partway up in the attic rather than leaving it on the floor. Just before 3 PM, it read 45.2°C, while outdoor air was about 35°C. A brief shower had just passed and the attic temperature was already coming down from a peak of 47.8°C, so I used a round ΔT = 10°C as the representative condition.
Using an air density of about 1.15 kg/m³:
Less than 1 pascal. My first reaction was basically, “Can a pressure difference that small really move much air?”
The air has to pass through both the intake and the ridge
Air does not just pass through the intake and stop. It must follow the full path: Intake → attic → Ridge. So I combined the inlet and outlet openings as two restrictions in series.
Using Cd = 0.6
Real air does not flow through an opening as perfectly as the ideal equation suggests. Contraction, turns, separation, and other losses reduce the actual flow. Those effects are lumped into the discharge coefficient, Cd.
The ASHRAE Handbook includes an example using Cd = 0.6 as a representative value for a sharp-edged opening when detailed pressure-loss data are unavailable.[3]
This is not a measured Cd for IntakePro or Rigid Vent 3. But I’m not trying to predict airflow to within a few percent—I just want to know whether this is tens, hundreds, or around a thousand CFM. For that purpose, I fixed Cd at 0.6.
Estimating CFM with the orifice flow equation
I used the standard Orifice Flow Equation to convert pressure difference into airflow.
With no wind, ΔP comes only from stack effect.
Even with no fan at all, the model gives more than 600 CFM from temperature difference alone.
Now add wind
Wind changes the static pressure around a building. The dimensionless value used to describe that is the pressure coefficient, Cp.
If the difference between the intake and ridge is ΔCp = Cp,in − Cp,out, the wind-driven pressure difference is:
The intake “pushes,” the ridge “pulls”
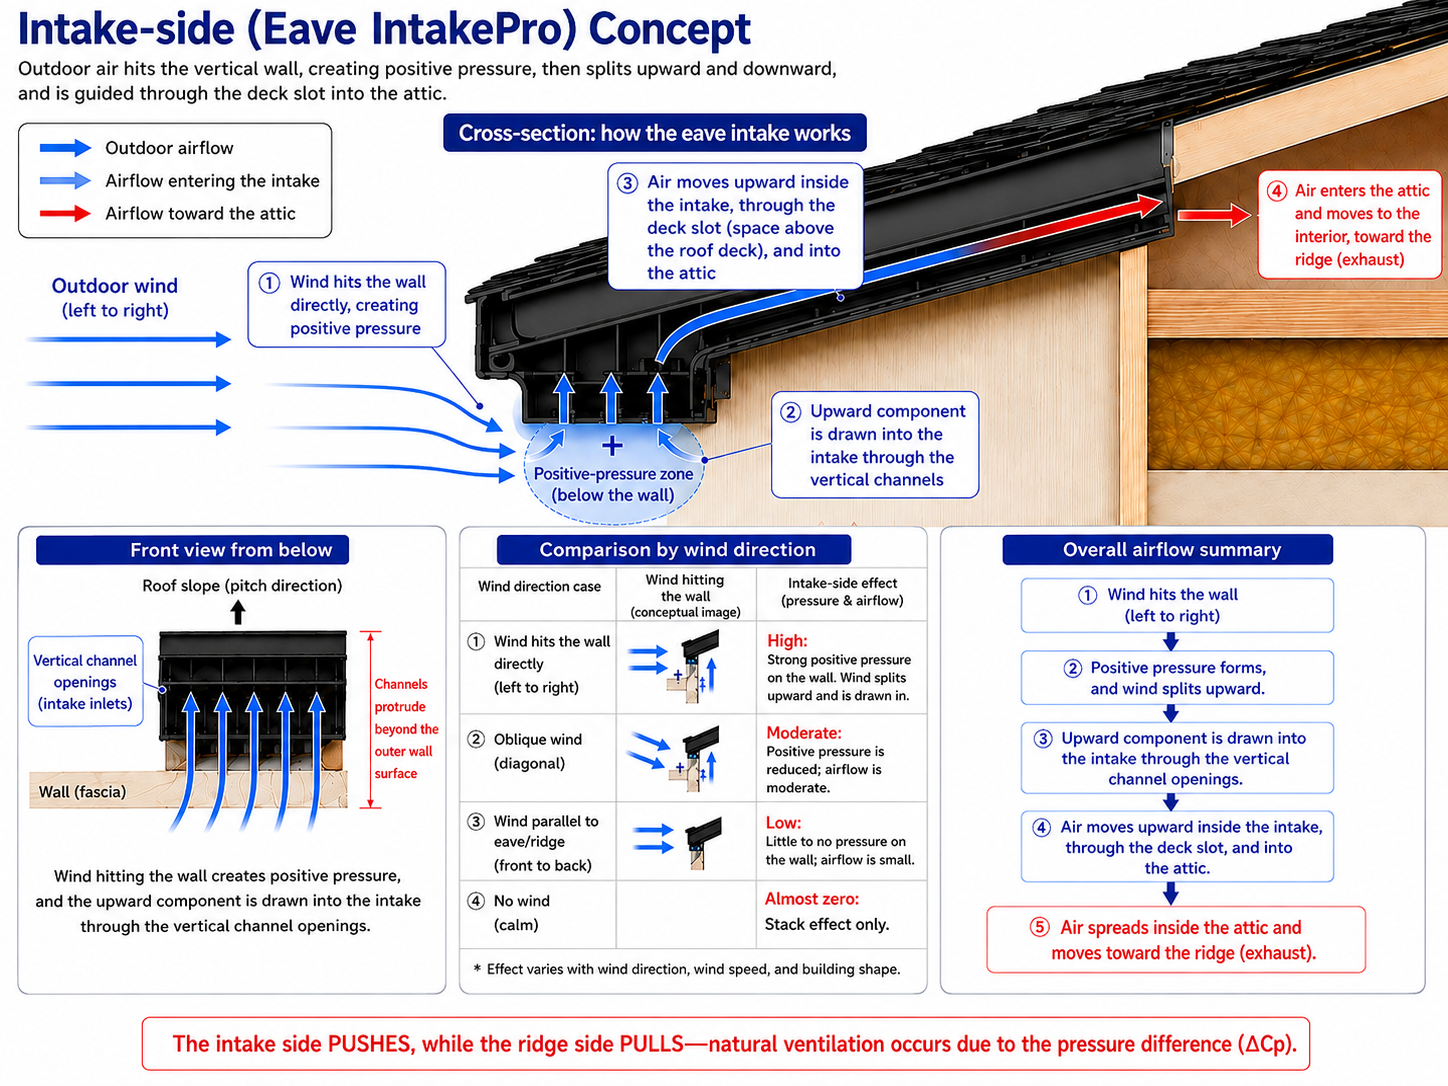
When wind hits the eave-side wall more or less head-on, the flow slows near the wall and tends to create positive pressure. The flow then splits, and the upward component can feed the IntakePro channels.
At the ridge, the external baffle appears to turn the outside airflow upward and create a local low-pressure region near the exhaust opening. That is the pulling side of the system.
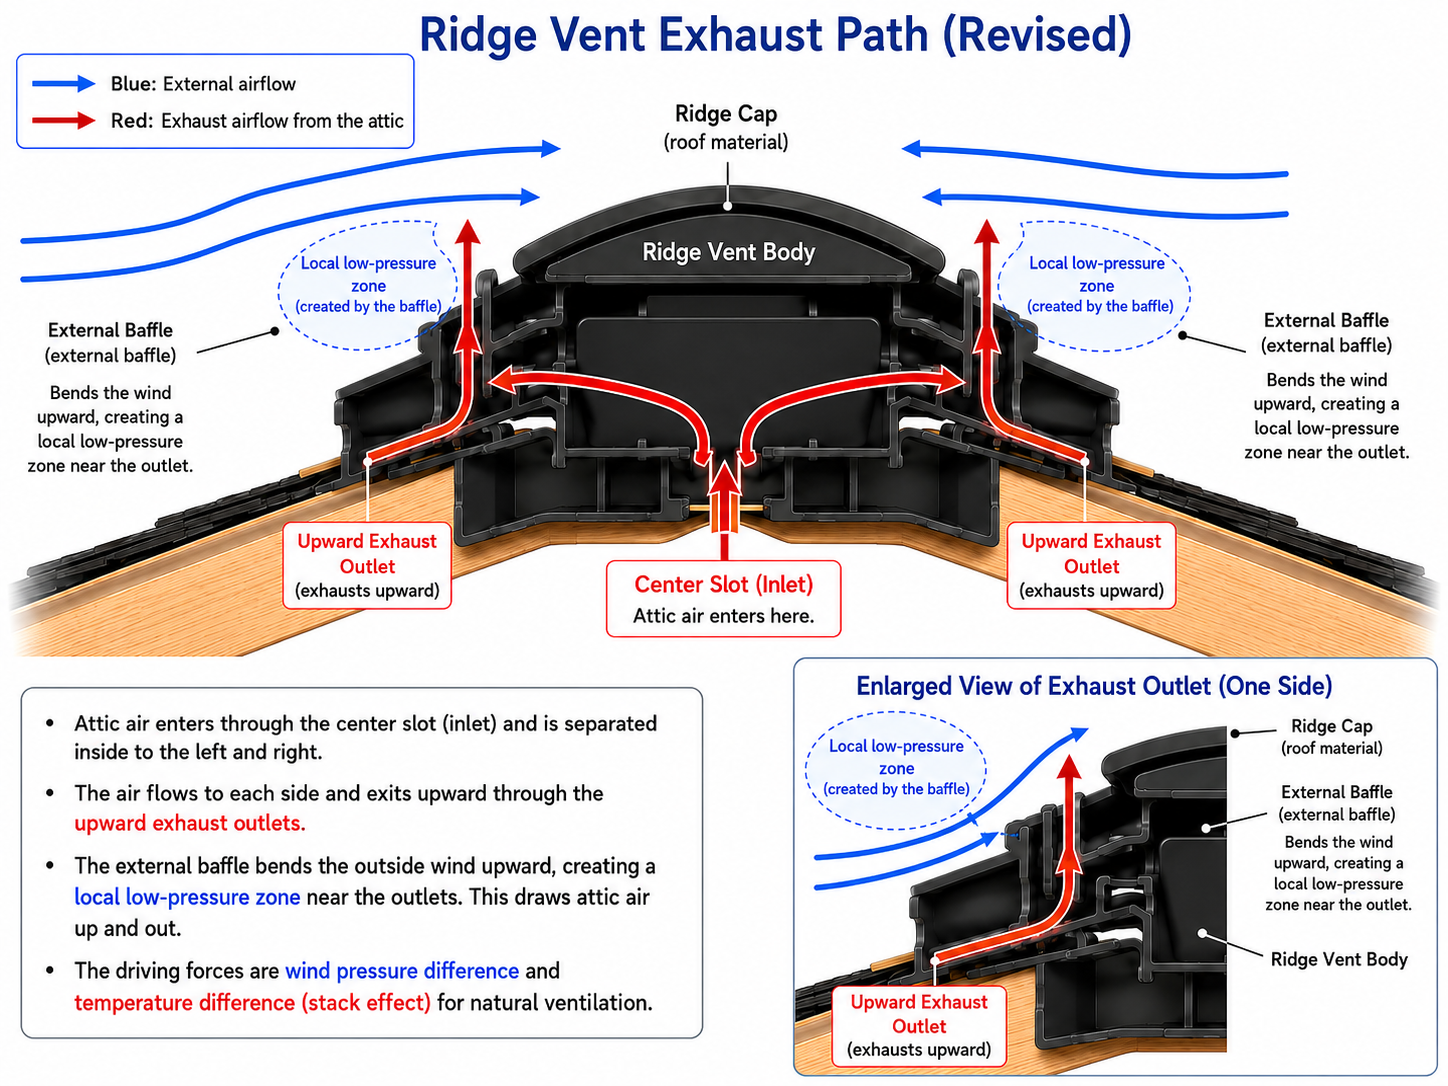
So with a favorable wind direction, you get positive pressure at the intake + suction at the ridge. That pressure difference is what ΔCp represents.
The two diagrams above are conceptual flow illustrations, not CFD results.
I did not use just one ΔCp
Actual Cp changes with wind direction, roof shape, neighboring houses, trees, and more. So I ran ΔCp at 0.1 / 0.3 / 0.5 / 0.7 and used 0.3 as the representative “normal to moderately favorable” case.
| ΔCp | Interpretation |
|---|---|
| 0.1 | Unfavorable wind direction; weak push at the intake and weak suction at the ridge |
| 0.3 | Normal to moderately favorable; representative case used here |
| 0.5 | Strong intake push and ridge suction |
| 0.7 | Upper favorable case where both effects line up well |
A full-scale sloped-roof study by Gullbrekken et al. reported an average ΔCp of 0.7 for engineering evaluation of roof ventilation.[4] It is not the same vent geometry as this roof, so I did not use 0.7 as the default—only as an upper-case anchor.
What happens as wind speed increases?
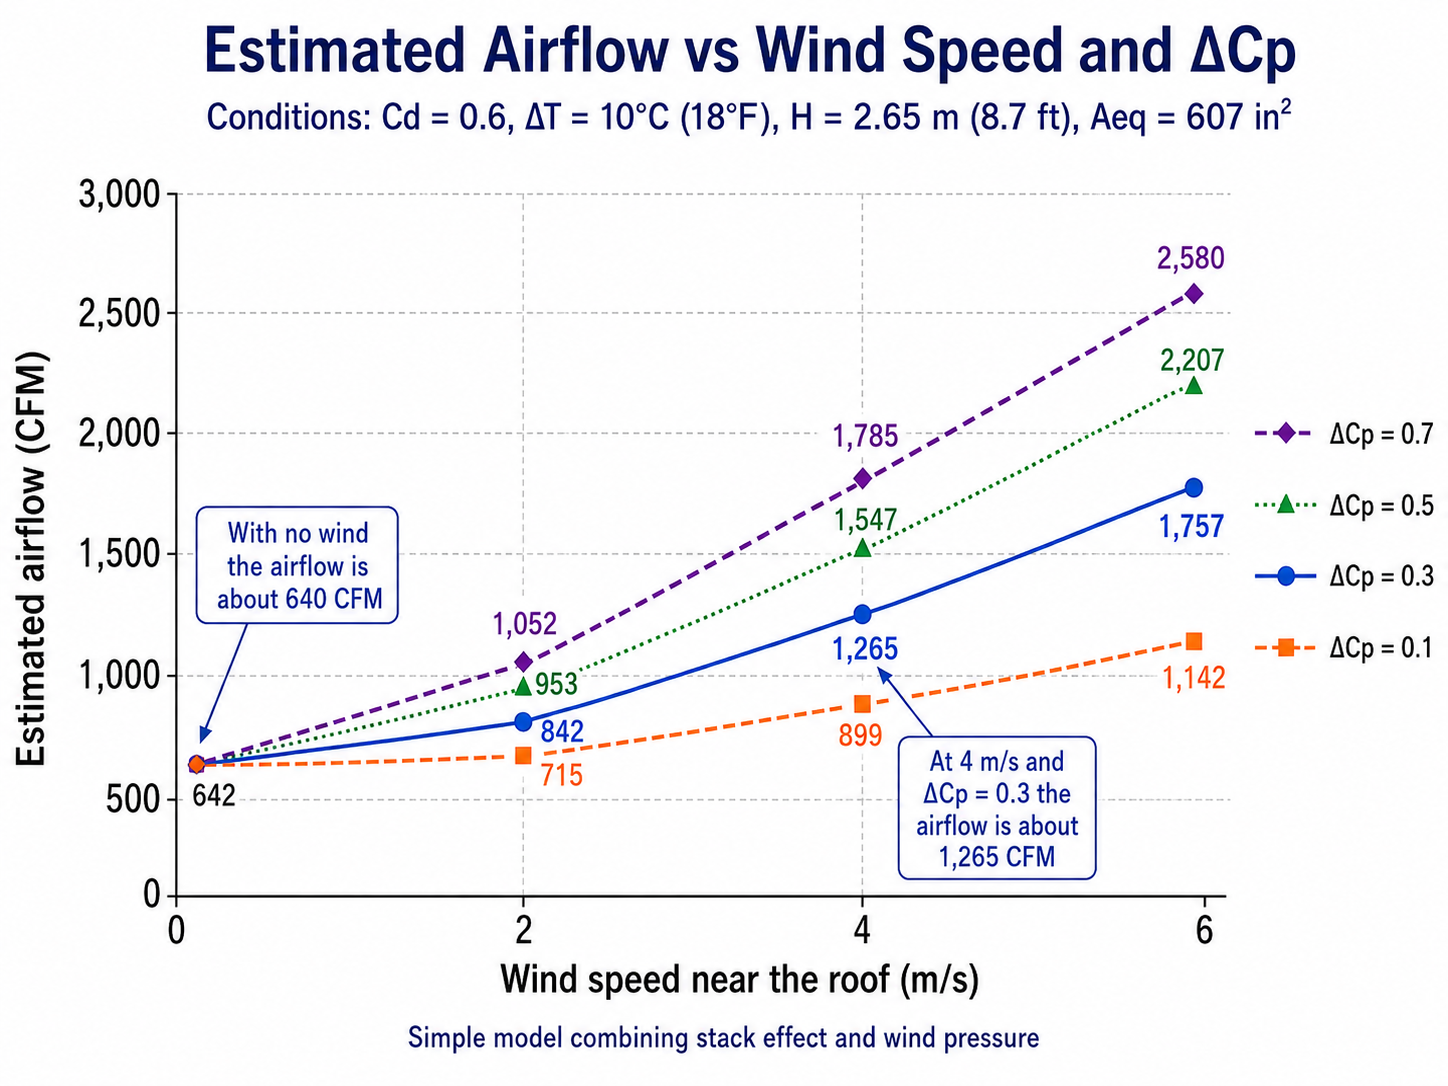
| Wind speed | ΔCp=0.1 | ΔCp=0.3 | ΔCp=0.5 | ΔCp=0.7 |
|---|---|---|---|---|
| 0 m/s | 642 | 642 | 642 | 642 |
| 2 m/s | 715 | 842 | 953 | 1,052 |
| 4 m/s | 899 | 1,265 | 1,547 | 1,785 |
| 6 m/s | 1,142 | 1,757 | 2,207 | 2,580 |
With the representative ΔCp = 0.3 case, the estimate goes from about 642 CFM with no wind to 842 CFM at 2 m/s and 1,265 CFM at 4 m/s. Seeing the model cross 1,000 CFM with a moderate breeze was honestly the surprising part.
How does that compare with a powered attic fan?
Residential powered attic ventilators are available around the 1,000–1,600 CFM range.[5] Putting those numbers next to the estimate makes the scale easier to understand.
| Condition | Airflow |
|---|---|
| This estimate: no wind | About 642 CFM |
| This estimate: 2 m/s, ΔCp=0.3 | About 842 CFM |
| This estimate: 4 m/s, ΔCp=0.3 | About 1,265 CFM |
| Powered attic fan product examples | Roughly 1,000–1,600 CFM |
A light breeze gets the estimate close to the lower end of powered attic fans, and the 4 m/s representative case goes beyond 1,000 CFM. This is only an order-of-magnitude comparison: powered-fan CFM is a product rating under defined test conditions, while the passive value here comes from a simplified model.
What does that mean in ACH?
CFM alone does not tell you how quickly the attic volume is being exchanged, so I also converted the results to ACH—Air Changes per Hour. It tells you how many attic-volume equivalents pass through the space each hour.
The roof is a mix of hip and gable geometry, so the exact attic volume is difficult to determine. I estimated roughly 170–220 m³ from the roof dimensions, then fixed the calculation at the midpoint, 195 m³, so the comparisons stay easy to read.
| Condition | CFM | ACH |
|---|---|---|
| No wind | 642 | 5.6 /hr |
| 2 m/s, ΔCp=0.3 | 842 | 7.3 /hr |
| 4 m/s, ΔCp=0.3 | 1,265 | 11.0 /hr |
If the real attic volume differs from 195 m³, the ACH value changes proportionally. I fixed the volume here only to make the scenarios easy to compare.
How much heat is that ventilation carrying out?
Finally, I estimated the sensible heat carried out by the ventilation air.
With ΔT fixed at 10°C, the heat-removal estimate scales almost directly with airflow.
| Condition | CFM | Heat removal |
|---|---|---|
| No wind | 642 | About 3.5 kW |
| 2 m/s, ΔCp=0.3 | 842 | About 4.6 kW |
| 4 m/s, ΔCp=0.3 | 1,265 | About 6.9 kW |
| 6 m/s, ΔCp=0.3 | 1,757 | About 9.6 kW |
Is several kilowatts of heat removal too much?
When I first saw the numbers, my reaction was, “Three to seven kilowatts through roof vents?” So I compared that with the scale of solar energy hitting the roof.
The U.S. Department of Energy uses 1,000 W/m² as the irradiance level for photovoltaic Standard Test Conditions.[6] That is not a measurement from this particular Houston afternoon—it is simply the standard “1 sun” reference level.
A California Energy Commission report lists Houston’s August horizontal daily solar irradiation at about 5.47 kWh/m²/day.[7] Multiplying by 186.44 m² gives roughly 1,020 kWh/day of solar energy on a horizontal-projection basis.
Obviously, not all of that becomes attic heat. Some is reflected, some leaves by convection and long-wave radiation, and roof pitch and solar angle matter. Still, against a roof receiving solar energy on the order of 100+ kW at peak conditions, carrying a few kilowatts away through ventilation no longer looks like an absurd order of magnitude.
Without ventilation, not all of that heat would enter the living space. Ceiling insulation and other heat-transfer paths matter. The number here is specifically the sensible heat being carried out of the attic by the ventilation air.
So, does the attic actually cool down?
Up to this point, everything has been a calculation based on vent dimensions, temperature difference, and wind pressure. But a model saying the attic can ventilate is not the same as seeing what the attic actually does.
So I logged the attic temperature from late afternoon through the next morning. The outdoor-temperature line is not an on-site measurement; it uses nearby public weather observations as a proxy.
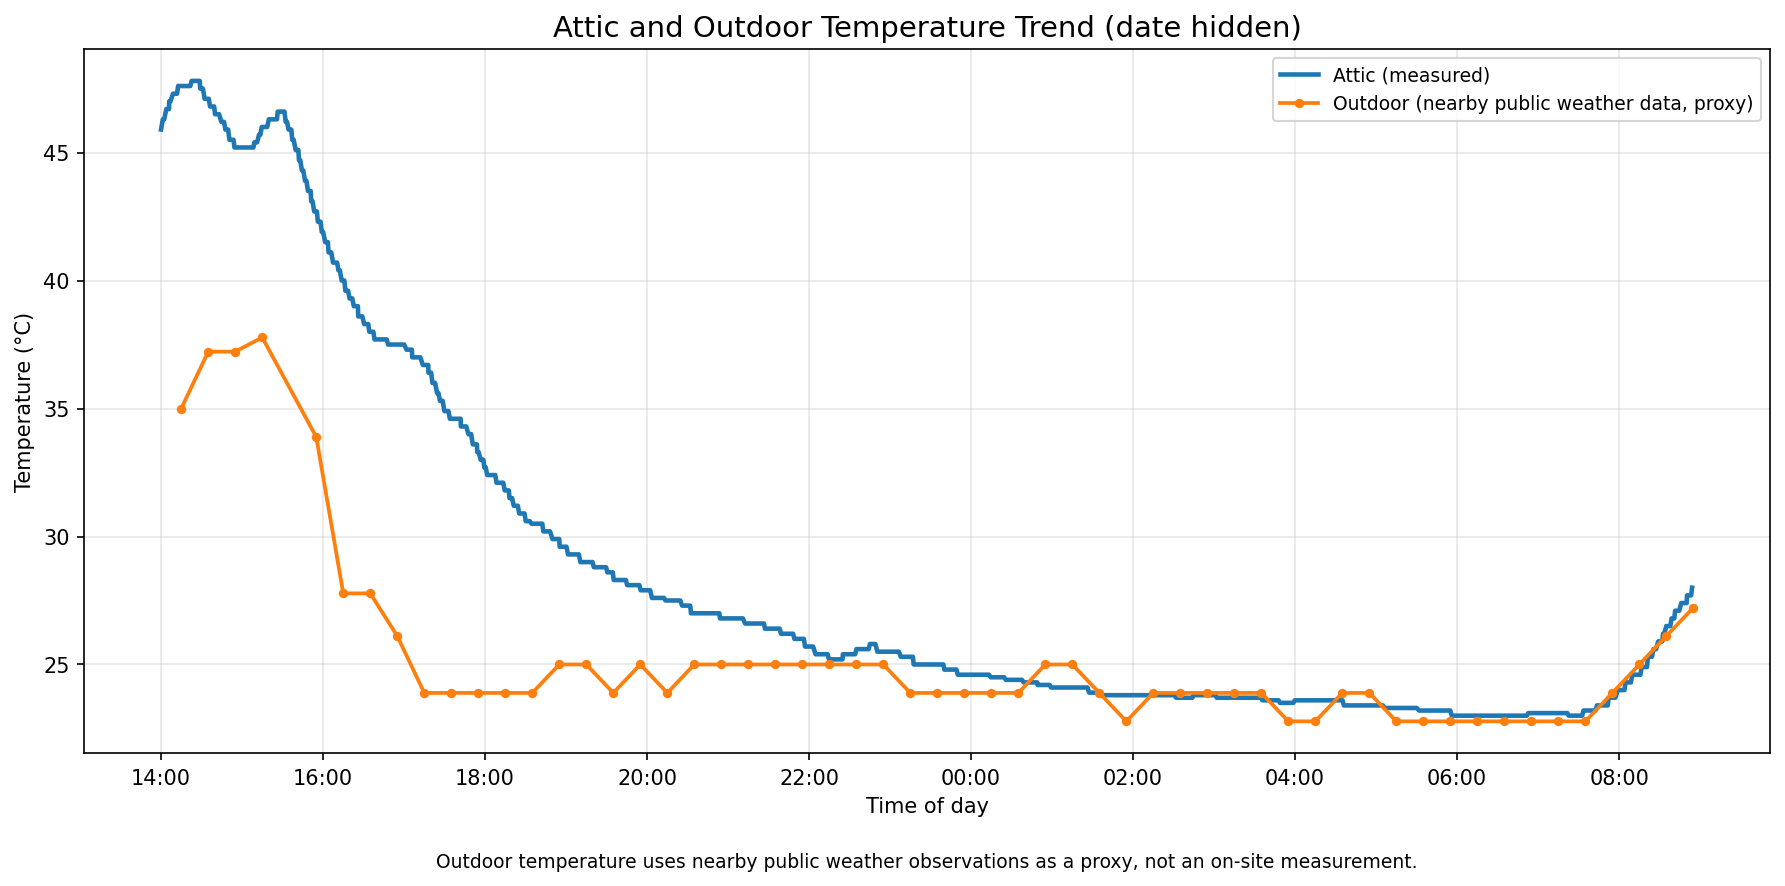
During the afternoon, the attic was around 45–48°C (113–118°F). After that, the attic temperature fell along with the outdoor temperature, with a clear time lag. By late night into early morning, the attic temperature had converged to almost the same level as the outdoor air.
This does not prove a specific CFM value. Heat loss through the roof surface and nighttime radiative cooling are happening at the same time.
Still, the attic is clearly not holding onto its daytime heat all night. Its temperature tracks the outdoor cooldown and eventually approaches it. That behavior is consistent with the passive ventilation actually working.
It is not a direct airflow measurement, but the theoretical model and the measured temperature behavior at least point in the same direction.
What I learned from the calculation
I started with a simple question: “There’s no fan—does this passive ventilation really do much?”
Plugging in the measured vent lengths and attic temperature gives about 642 CFM even with no wind. With favorable wind, the positive-pressure intake side and the low-pressure ridge side can push the estimate into the 1,000 CFM range.
Again, this is not a direct CFM measurement. Actual airflow will change with product-specific pressure loss, local roof-level wind speed, wind direction, neighboring houses, trees, and other details.
But the exercise did answer the question I actually cared about: this is not obviously a “tens of CFM” system—it can plausibly be in the hundreds to low-thousands of CFM. The overnight temperature log also shows the attic following the outdoor cooldown, so this does not look like a calculation-only story.
It looks like nothing more than openings in a roof, but the system is using temperature-driven buoyancy, positive pressure at the intake, and suction at the ridge. Passive ventilation turned out to be a lot more interesting than I expected.
Research. Try. Fail. Learn. Enjoy.
References
- GAF. Cobra IntakePro® Rooftop Intake Vent — Product Data. NFA 9 in²/linear ft. Product data
- GAF. Cobra® Rigid Vent 3™ — Product Data / Attic Ventilation Guidance. NFA 18 in²/linear ft, balanced ventilation, 1/300 rule. Product data
- ASHRAE. ASHRAE Handbook—Fundamentals, Chapter 59: Indoor Airflow Modeling. Example use of Cd=0.6 for an opening when detailed pressure-loss data are unavailable. ASHRAE Handbook
- Gullbrekken L, Uvsløkk S, Kvande T, Pettersson K, Time B. “Wind pressure coefficients for roof ventilation purposes.” Journal of Wind Engineering and Industrial Aerodynamics. 2018;175:144–152. DOI: 10.1016/j.jweia.2018.01.026. ScienceDirect
- Broan-NuTone. Roof Mounted Powered Attic Ventilators — Specification Sheet. Product examples around 1,000 and 1,600 CFM. Specification sheet
- U.S. Department of Energy, FEMP. Optimizing Solar Photovoltaic Performance for Longevity. Standard Test Conditions: irradiance 1,000 W/m². DOE
- California Energy Commission. Monthly and Seasonal Daily Solar Irradiation — Houston, Texas. August horizontal irradiation: 5.47 kWh/m²/day. Report PDF
The CFM, ACH, and heat-removal values in this article are estimates from a simplified model using measured dimensions and temperature. Actual results will vary with local wind and product-specific pressure losses.
Questions or comments about this article?
If you have questions about the calculation, want to see another scenario, or think there is something else worth measuring, feel free to send a note. Add your email if you would like a reply.
The website is where I organize the measurements and calculations after the fact. On X, I post the in-between part too—things like “What is the attic temperature today?”, “Does more wind make a noticeable difference?”, and “What should I measure next?”